If you manage the performance of your bank, one indicator you track is the NIM. The NIM is a very reliable indicator of the bank’s ability to earn interest income on the money it takes. It has also descriptive value in strategy as it is impacted by strategic choices, including which markets to compete, the bank’s risk strategy and its competitive advantage to attract funding and underwrite loans.
So, what if you could use your “NIM tracking” one step further and use it to strategically benchmark your bank against its competitors?
To do this, instead of calculating your NIM by dividing your net interest income by interest-earning assets, you can use this formula:
NIM = ( A – ( R / L ) ) * LIA + O
Where:
(A) Average Loan Yield
(R) Rates Paid on Deposits
(L) Loan-To-Deposits
(LIA) Loans / Interest Earning Assets
(O) Impact of other interest-earning assets and liabilities on NIM
Looking at the NIM this way (and comparing yours to your competitors’) is interesting because it allows you to understand what part of your business is driving your NIM.
For example, I once examined a group of peer banks, which posted NIMs ranging from 2.6-3.6.
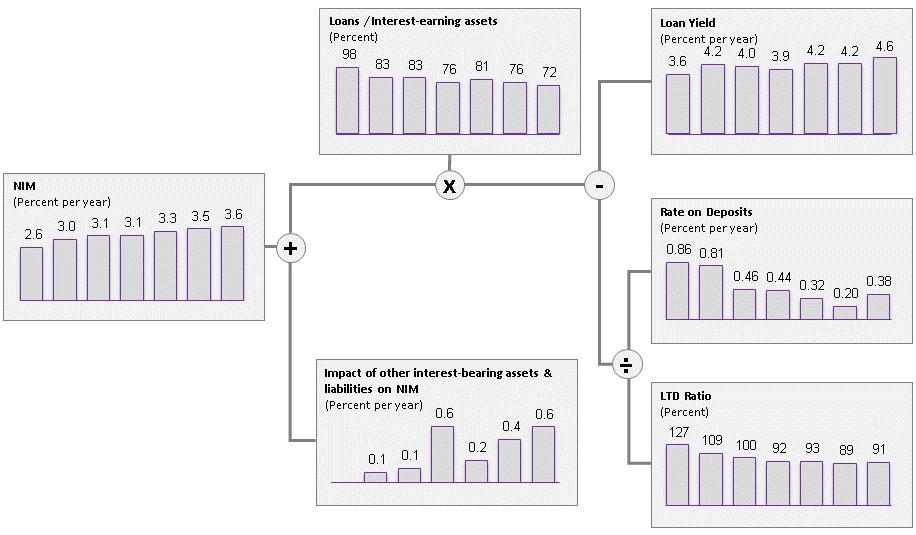
Once we examined the individual factors, what we found out was (each column is a different bank):

As you can see, part of the difference between the banks could be explained by risk management and business model decisions (as illustrated by differences in LTD and Loans/Interest Earning Assets). The other part was explained by the banks’ ability to book attractive loans and attract deposits.
So what to do with this information?
The first step is to use this picture to discuss your strategic options. Trying to maximize each and every driver is seldom the best answer: you may decide to use more expensive funding sources if you see attractive uses for the funds and the risk is acceptable. For example, scaling up and down wholesale deposits may be easier, faster, less costly and less risky than building or fixing your customer deposit operations.
Ask: among your peers, what are the best performers doing? Are they taking risks you are not comfortable with? If that is the case, given your risk appetite, what is the limit of your current model (how high can you really get)? Which of these factors, if improved, would have the highest impact on your results?
Once the strategic model has been decided (a decision which should be based not only on NIM but all aspects of your business) this map can be used to prioritize, set goals and track the progress of projects designed to improve these factors.
For example, if your cost of funding is a priority, a strategic project could be to segment your clients to understand their individual sensitivity to rates and create special offerings for these segments. Or improve your pricing based on a better view of the value of each client.


